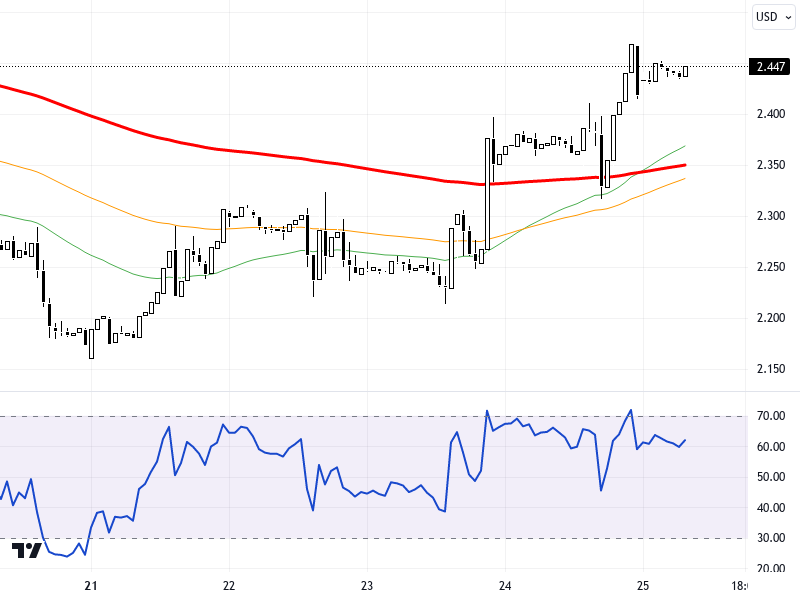
NGCUSD
U.S. natural gas futures are drawing attention due to the favorable impact of upcoming stock data and weather conditions. The stock figures to be released today by the U.S. Energy Information Administration could have a significant impact on the markets. Stock market movements in the U.S. and Europe may also influence natural gas pricing. Additionally, the decline in U.S. bond yields and political developments in Japan are affecting global market dynamics. Economic indicators such as the Michigan Consumer Sentiment and the German IFO Business Climate Index continue to play a role in determining investors' risk appetite.
In the chart, when examining the NGCUSD pair on a daily time frame, levels of 2.97, 2.94, and 2.91 stand out as support, while levels of 3.04, 3.07, and 3.1 can be monitored as resistance. It is observed that the pair has increased by 1.20% compared to the previous day. The RSI indicator is at the level of 65 and presents a positive outlook, indicating that the upward trend might continue. However, it should be noted that maintaining levels above 2.91 is necessary in the short term.
Support :
Resistance :


