GBPUSD
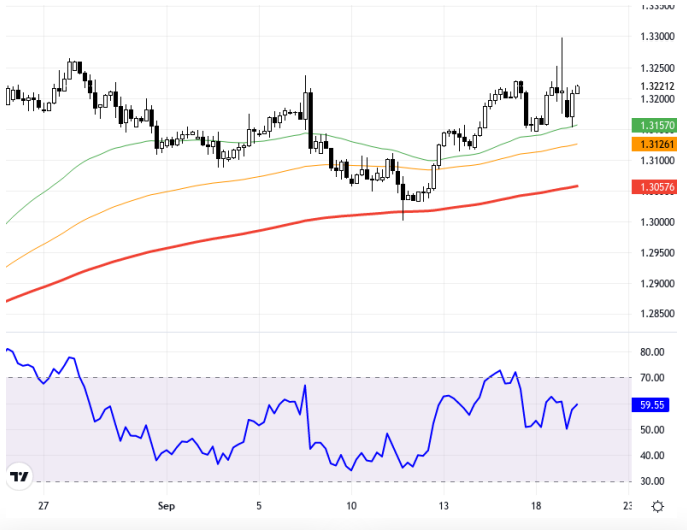
The GBP/USD pair is experiencing a volatile course due to the Fed's interest rate cuts and optimistic expectations regarding the U.S. economy. This indicates that the pair is influenced by macroeconomic factors and is closely related to the direction of the Dollar Index. While the Fed's rate cut causes an increase in the pair, these gains have been given back following subsequent statements. Expectations for an interest rate cut by the Bank of England in upcoming meetings should be monitored carefully. The positive sentiment observed in external markets creates uncertainty for the pair ahead of the BoE meeting. Technically, the GBP/USD is monitored on a 4-hour chart and is currently trading at the 1.3157 level. The pair is displaying a positive outlook by being above the 55 and 89 period moving averages (1.3130 and 1.3150). The RSI indicator is at 59.53 and on a positive trend. Compared to the previous day, there has been an increase of approximately 0.0122%. In upward movements of the pair, the 1.3265 and 1.3640 resistance levels can be observed, while in downward movements, the 1.3130 and 1.3067 support levels can be monitored. Support:1.315 - 1.313 - 1.308 - Resistance:1.322 - 1.3265 - 1.3315
GBP/USD paritesi, Fed'in faiz indirimleri ve ABD ekonomisine dair iyimser beklentilerle dalgalı bir seyir izliyor. Bu durum, paritenin makroekonomik açıdan etkiler altında olduğunu ve özellikle Dolar Endeksi'nin yönüyle yakından ilişkili olduğunu gösteriyor. Fed'in faiz düşüşü, paritenin artış göstermesine sebep olurken, ardından gelen açıklamalarla bu kazançlar geri verilmiş durumda. İngiltere Merkez Bankası'nın önümüzdeki toplantılar için faiz indirimi beklentisi ise dikkatle izlenmeli. Dış piyasalarda gözlenen pozitif hava, BoE'nin toplantısı öncesinde parite üzerinde belirsizlik yaratıyor. Teknik olarak, GBP/USD 4 saatlik grafikte izleniyor ve şu anda 1,3157 seviyesinde işlem görüyor. Parite, 55 ve 89 periyotluk hareketli ortalamaların (1,3130 ve 1,3150) üzerinde bulunarak pozitif bir görünüm sergiliyor. RSI göstergesi ise 59,53 seviyesinde ve pozitif bir eğilimde bulunuyor. Önceki güne göre değişim %~0,0122 oranında artış göstermiş. Paritenin yukarı yönlü hareketlerinde 1,3265 ve 1,3640 direnç seviyeleri, aşağı yönlü hareketlerde ise 1,3130 ve 1,3067 destek seviyeleri izlenebilir. Destek:1.315 - 1.313 - 1.308 - Direnç:1.322 - 1.3265 - 1.3315 -


