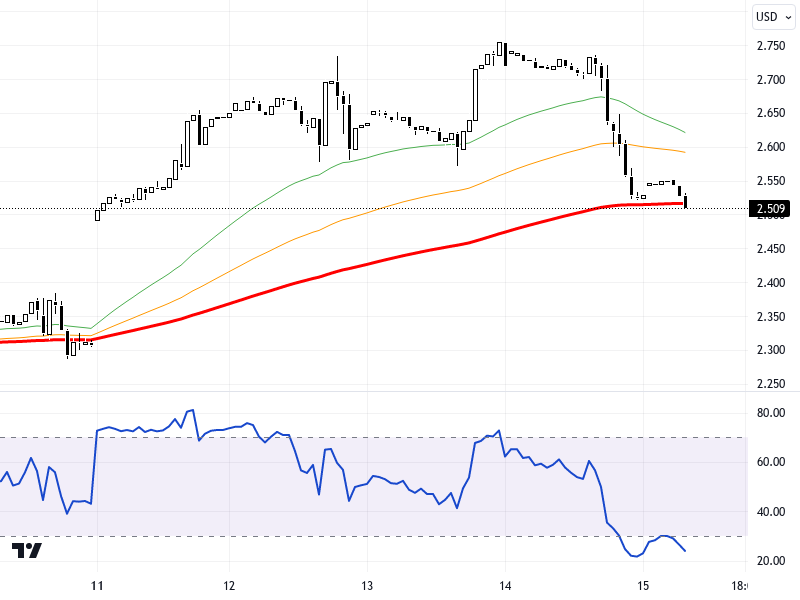
NGCUSD
U.S. natural gas futures continue to remain under pressure as stocks are about 6% above the seasonal average. This situation is limiting the upward movement of prices, despite the expected cold wave by the end of November. The course of European and U.S. markets could influence natural gas pricing. Recovery efforts in Asian markets and retail sales data from the U.S. are also being closely monitored in international markets. Fed Chair Powell's statement that there will be no rush to cut rates may lead market participants to reassess their inflation expectations.
From a technical perspective, the NGCUSD pair is trading below the 2.77 resistance level on the daily chart. In downward movements, the 2.73 and 2.7 support levels could be significant. In the event of an upward recovery, the 2.8 and 2.82 resistance levels should be watched. The RSI indicator is at the 45 level, indicating a neutral market outlook. The pair has declined by 0.79% compared to the previous day, which may indicate that the selling pressure continues.
Support :
Resistance :


